Compare Solar vs Utility Costs: 2026 Homeowner Guide
Compare Solar vs Utility Costs: 2026 Homeowner Guide

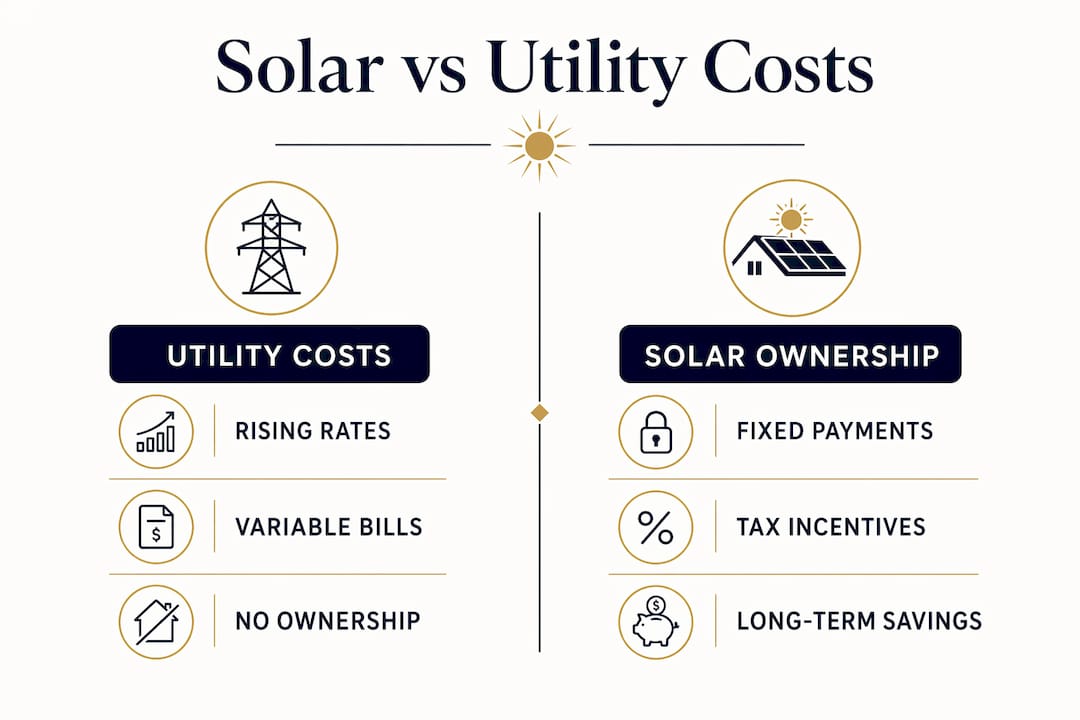
Solar energy cost comparison is the process of measuring what you pay for grid electricity today against the total cost of owning a solar system over its lifetime. U.S. residential electricity rates rose 9.5% year-over-year in early 2026, far above the historical average of 3.5% annually. Solar fixes your energy cost upfront, so every rate hike after installation works in your favor. San Diego homeowners who compare solar vs utility costs carefully find that the math shifts decisively toward solar within the first decade. Most see electric bill reductions of 80–92% and full payback in 5–7 years.
How to accurately compare solar vs utility costs
Accurate comparison starts with two numbers: what you pay now and what solar would cost you over time. Most homeowners skip one or both, which leads to bad decisions.
Step 1: Calculate your current utility cost
Pull your last 12 months of SDG&E bills and find your total kilowatt-hours used and your average rate per kWh. U.S. electricity rates range from $0.09 to $0.37 per kWh depending on state, with California consistently at the high end. Multiply your monthly kWh by your rate to get your true monthly cost. Then multiply by 12 for your annual baseline.
Step 2: Build your solar cost estimate
A solar system cost has several components:
- Equipment: Panels, inverters, and mounting hardware
- Installation: Labor, wiring, and electrical work
- Permits and interconnection: City permits and SDG&E approval fees
- Maintenance: Minimal, but plan for inverter replacement around year 10–15
- Financing: Cash, loan, or prepaid lease each change your monthly outlay
The average 12 kW residential system costs about $31,135 before incentives in 2026, based on a national price range of $2.60–$3.40 per watt. That figure covers a household using roughly 10,500 kWh per year. Your system size and cost will differ based on your actual usage.
Step 3: Apply incentives and financing

The Section 25D federal tax credit expired December 31, 2025. State and local incentives now carry all the weight. California still offers property tax exclusions and net metering credits, though the rules changed under NEM 3.0. San Diego Solar’s prepaid lease program cuts upfront costs by 30–40%, which changes the monthly math significantly compared to a cash purchase.
Pro Tip: Get at least three quotes from licensed installers and ask each one to show you the same system size so you can compare price per watt directly, not just total price.
What factors drive the outcome when comparing energy expenses?
No two homes produce the same result. These variables move the numbers most:
- Your current rate. Homeowners paying $0.30+ per kWh in California save far more than those paying $0.12 in the Southeast.
- Utility rate inflation. California has exceeded 5% annual rate increases in recent years. Every percentage point of inflation adds to your 25-year savings from solar.
- System size versus actual usage. Oversizing wastes money. Undersizing leaves utility costs on the table. Match the system to your real consumption.
- Net metering policy. California’s NEM 3.0 reduces export credits, which means selling excess power back to the grid pays less than it used to.
- Battery storage. Adding a Tesla Powerwall, Enphase IQ, or Franklin WH battery lets you store midday solar generation and use it during peak rate hours. Battery systems increase self-consumption and reduce your dependence on grid power at the worst times.
- Panel degradation. Quality panels lose roughly 0.5% output per year. Factor that into your 25-year production estimate.
- Local sunlight. San Diego averages some of the best peak sun hours in the continental U.S., which improves production estimates compared to cloudy northern states.
Pro Tip: Use the National Renewable Energy Laboratory’s PVWatts calculator with your actual address to get a production estimate based on real local weather data, not a national average.
How to interpret payback periods and long-term savings
The payback period is the number of years before your cumulative utility bill savings equal your net system cost. After that point, electricity is effectively free.
What payback periods look like in 2026
The national average payback period ranges from 9–15 years, but that range hides enormous variation. States with high electricity rates, like Hawaii and Massachusetts, can see payback in under 7 years. Low-rate states like Louisiana can stretch past 15–20 years. San Diego sits in a favorable position because SDG&E rates are among the highest in the nation, which compresses payback timelines significantly.
The real value is what comes after payback
Most homeowners fixate on the payback period and miss the bigger point. Solar generates 10–15 years of low-cost electricity after the system pays for itself. That post-payback period is where the real financial return lives. A system that pays back in 8 years and lasts 25 years gives you 17 years of near-free power.
Total cost of ownership over 25 years
| Metric | Utility-only path | Solar ownership path |
|---|---|---|
| Year 1 annual cost | ~$2,400 (avg. U.S.) | System cost minus incentives |
| Rate escalation | 3.5–5%+ per year | Fixed at near zero |
| 25-year total spend | Compounding upward | Stable after payback |
| Estimated 25-year savings | $0 | $59,000 nationally; $80,000–$120,000 in CA |
| Grid independence | None | High with battery storage |
The cumulative cost of not installing solar compounds every year utility rates rise. That is the number most homeowners never calculate.
Pro Tip: Ask your installer for a 25-year cash flow projection that includes an assumed utility rate escalation of 4–5% annually. Then calculate the internal rate of return (IRR) on your net system cost. A well-designed San Diego system often outperforms many traditional investments on this metric.
How to tailor your solar evaluation to your home and habits
Generic national averages will not tell you what solar saves at your specific address. Personalizing the analysis takes less time than most homeowners expect.
Match your system to your actual usage patterns
Start by identifying when you use the most electricity. If your peak usage falls during midday hours, a solar-only system offsets it directly. If you run appliances in the evening, a battery becomes more valuable because it stores daytime generation for nighttime use. San Diego Solar designs every system around your actual usage data, not a template.
Time-of-use (TOU) rate plans from SDG&E charge more during peak hours, typically 4–9 PM. A solar-plus-battery system can eliminate most of that exposure. Flat-rate plans are simpler to model but offer less opportunity for strategic savings. Knowing which plan you are on changes the calculation meaningfully. You can review how NEM 3.0 affects your credits before committing to a system design.
Use local data, not national benchmarks
San Diego’s peak sun hours consistently exceed the national average. That means a smaller system here can produce the same output as a larger one in a cloudier market. The PVWatts tool from the National Renewable Energy Laboratory lets you input your ZIP code and roof angle to get a production estimate specific to your location. Pair that with your actual utility bill data and you have a solid foundation for a real solar vs power grid costs comparison.
Battery storage adds another layer of customization. Under NEM 3.0, utilities frequently alter export compensation rules, which makes self-consumption the smarter strategy. A battery lets you consume what you generate rather than selling it back at reduced rates. For a deeper look at whether storage makes sense for your home, the analysis of solar battery value covers the cost-benefit breakdown in detail.
Key Takeaways
Solar beats utility costs over time because it fixes your energy expense while utility rates keep rising, and the gap between the two paths widens every year.
| Point | Details |
|---|---|
| Utility rates are rising fast | U.S. residential rates rose 9.5% year-over-year in early 2026, making solar savings grow larger each year. |
| Federal tax credit is gone | The Section 25D credit expired December 31, 2025; state and local incentives now determine your net cost. |
| Payback is not the finish line | After payback, solar delivers 10–15 years of near-free electricity, which is where the real return accumulates. |
| Battery storage changes the math | Under NEM 3.0, self-consumption via battery beats selling excess power back to the grid at reduced rates. |
| Personalize before you commit | Local sun hours, your utility rate plan, and your usage timing all shift the outcome more than national averages suggest. |
What I’ve learned after watching homeowners run these numbers
Curtis Williamson
The most common mistake I see is treating the payback period as a pass-or-fail test. Homeowners hear “9 to 12 years” and walk away, when the real question is what happens in years 13 through 25. That is where solar becomes one of the best financial decisions a homeowner can make, especially in a market like San Diego where SDG&E rates have no ceiling.
The post-2025 incentive landscape is genuinely different. Without the federal tax credit, the analysis depends more on local policy, your specific rate plan, and whether you add battery storage. That is not a reason to hesitate. It is a reason to get a quote that reflects your actual situation rather than a national average.
The homeowners I see regret solar the least are the ones who sized their system correctly and added a battery. They are not just saving money. They are insulated from rate volatility in a way that no utility plan can replicate. Grid independence has real value that does not show up in a payback spreadsheet, but it shows up every time SDG&E announces another rate increase.
My honest advice: run the 25-year cash flow, not just the payback period. Factor in a 4–5% annual rate escalation. Then decide. The numbers almost always favor solar in San Diego, and they favor it more every year you wait.
— Curtis Williamson
How San Diego Solar helps you run the real numbers
San Diego Solar has been designing and installing residential solar systems across San Diego County since 1996, longer than any other local installer. Every consultation starts with your actual utility bills and your roof, not a national average.

San Diego Solar’s in-house engineering team builds a custom system around your usage, your rate plan, and your goals. The residential solar consultation is free, and you receive a written project timeline and pricing before you commit to anything. For homeowners who want to maximize savings under NEM 3.0, San Diego Solar integrates Tesla Powerwall, Enphase IQ, and Franklin WH battery storage options into every system that benefits from them. Thirty years of in-house installations, zero subcontractors, and manufacturer warranties up to 25 years back every project.
FAQ
How do I compare solar vs utility costs for my home?
Pull your last 12 months of utility bills to find your total kWh usage and average rate, then get a solar quote sized to that usage. Subtract available state incentives from the system cost and compare the net cost against your projected 25-year utility spend using a 4–5% annual rate escalation.
What is a realistic solar payback period in 2026?
The national average payback period ranges from 9–15 years, but San Diego homeowners typically see payback in 5–7 years because SDG&E rates are among the highest in the country.
Does the federal solar tax credit still apply in 2026?
No. The Section 25D federal residential tax credit expired December 31, 2025. Savings now depend on California state incentives, property tax exclusions, and net metering credits under NEM 3.0.
Is battery storage worth adding to a solar system?
Yes, especially under NEM 3.0. Battery systems increase self-consumption and protect you from peak utility rates, which matters more now that export credits pay less than they used to.
How much can solar save over 25 years?
25-year savings average $59,000 nationally and reach $80,000–$120,000 in high-rate states like California, driven by compounding utility rate increases that solar owners avoid entirely.