Solar Panel Efficiency Rating: What the % Actually Means
Solar Panel Efficiency Rating: What the % Actually Means
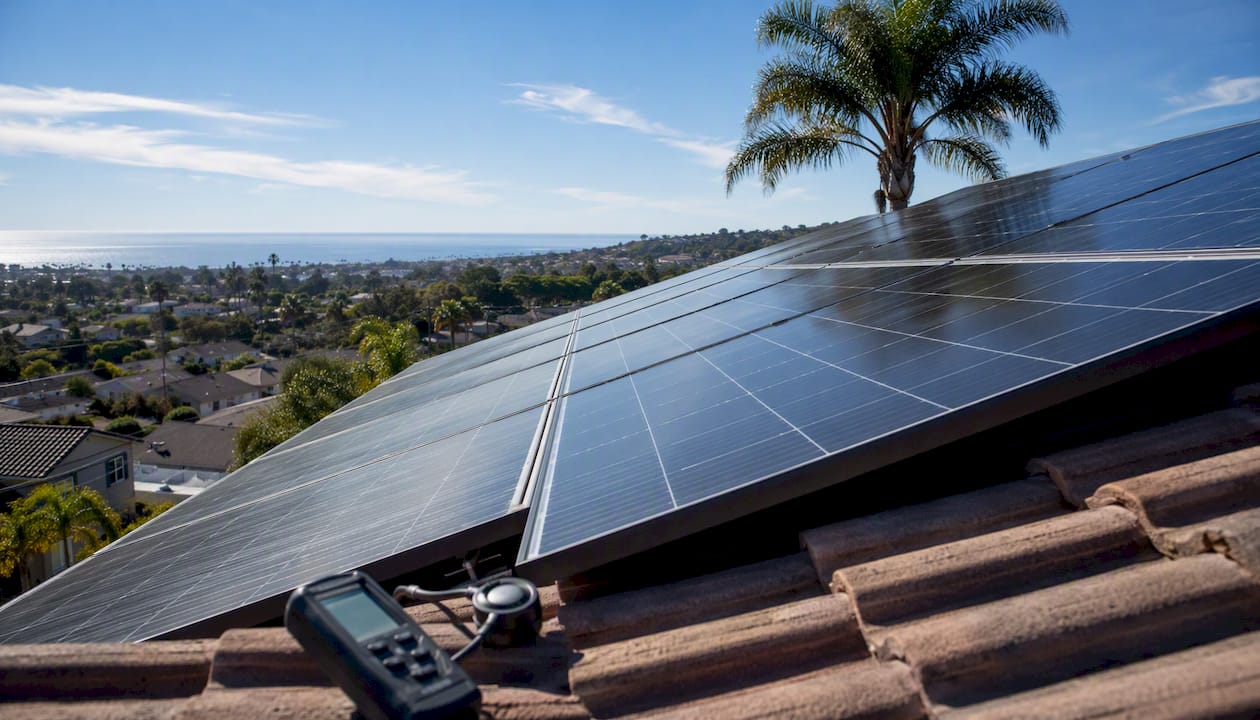
A solar panel efficiency rating is the percentage of sunlight hitting a panel’s surface that gets converted into usable electrical power, measured under a standardized lab test called Standard Test Conditions (STC). A typical 400W panel with a little over 20% efficiency converts around one-fifth of incoming solar energy into electricity, while the remainder is lost as heat or reflected light. For most homeowners, the practical takeaway is this: efficiency matters most when your roof space is limited. A higher-rated panel produces more power per square foot, influencing how many panels you need and the overall system cost.
Table of Contents
- What the efficiency percentage is actually counting
- How manufacturers measure efficiency: STC, AM1.5G, and NOCT
- What efficiency ranges look like today and which technologies produce them
- Factors that change how an efficiency rating translates to actual energy production
- Is higher efficiency always better? Cost, space, and ROI trade-offs
- What professional installers look at beyond the efficiency number
- How to improve your system’s effective efficiency
- Key Takeaways
- The efficiency number is only the starting point
- San Diego Solar’s approach to panel selection and yield modeling
- Authoritative sources and tools for modeling your system
What the efficiency percentage is actually counting
The formula behind every panel’s efficiency rating is straightforward:
Efficiency (%) = [Power output (W) ÷ (Panel area in m² × 1000 W/m²)] × 100
The DOE explains that manufacturers measure this using current-voltage (I-V) testing under a constant, standardized light level and cell temperature, which produces the peak power output (Pmax) stamped on every datasheet.
A quick example: a panel rated at 400W with a surface area of 1.9 m² gives an efficiency percentage a bit above 20%. That number tells you exactly how much of the sun’s energy that panel captures per unit of roof space.
Here is where it gets important to understand the difference between cell efficiency and module efficiency:
- Cell efficiency is measured on an individual solar cell in a lab, stripped of all packaging. Lab records for silicon cells run significantly higher than anything you can buy at retail.
- Module efficiency is the number on the datasheet. It accounts for the full panel: the frame, gaps between cells, wiring, and encapsulant. Module efficiency is always lower than cell efficiency because some of the panel’s surface area is not active photovoltaic material.
- NREL’s champion module chart illustrates this gap clearly: lab-cell records for silicon technologies far exceed what any commercial module achieves at nameplate.
- The efficiency % on a spec sheet is always the module number, not the cell record. Never compare a manufacturer’s cell-level claim to a competitor’s module-level datasheet number.
How manufacturers measure efficiency: STC, AM1.5G, and NOCT
Every panel’s rated efficiency comes from a test run under Standard Test Conditions (STC): 1,000 W/m² of irradiance, a cell temperature of exactly 25°C, and the AM1.5G solar spectrum. AM1.5G simulates sunlight passing through 1.5 atmospheres of air at a 48.2° angle, which approximates average mid-latitude conditions. STC exists because it gives every manufacturer a common baseline for comparison, not because it reflects what your roof actually experiences.
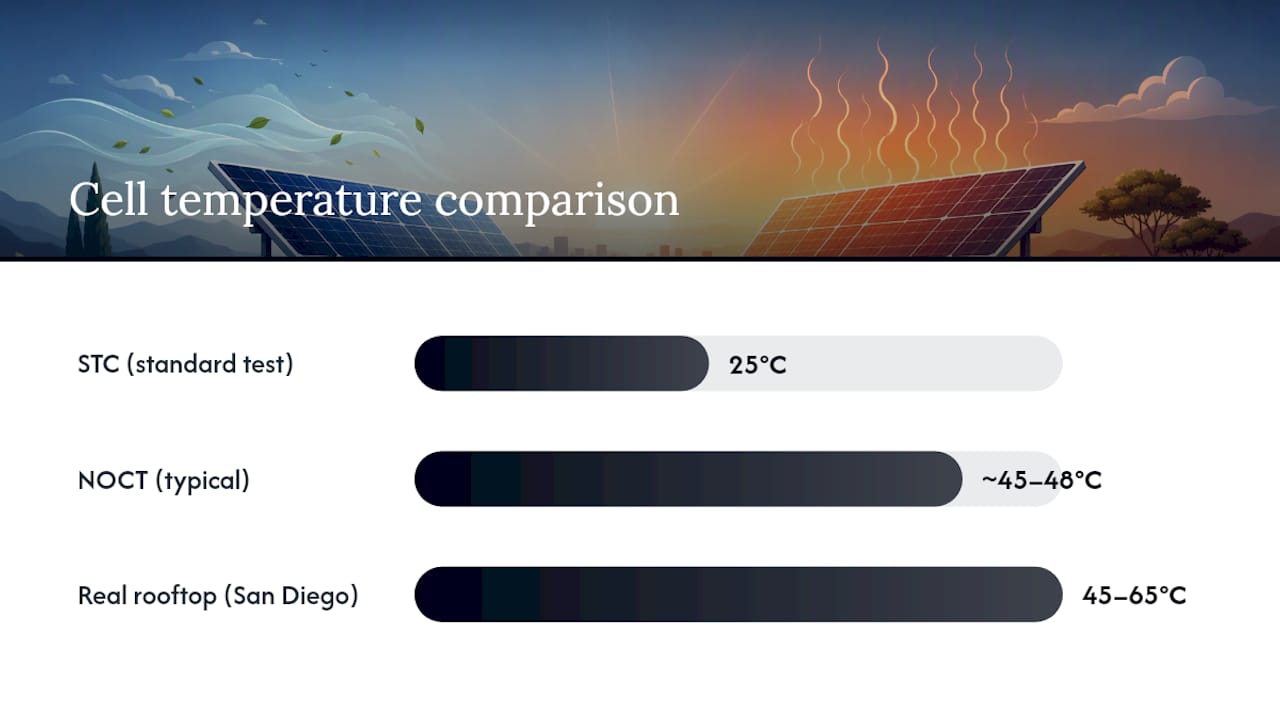
The problem is that real rooftops run hotter. A panel sitting in full San Diego sun on a summer afternoon can reach 45–65°C at the cell, not 25°C. That temperature gap alone reduces output meaningfully, because silicon panels lose power as they heat up.
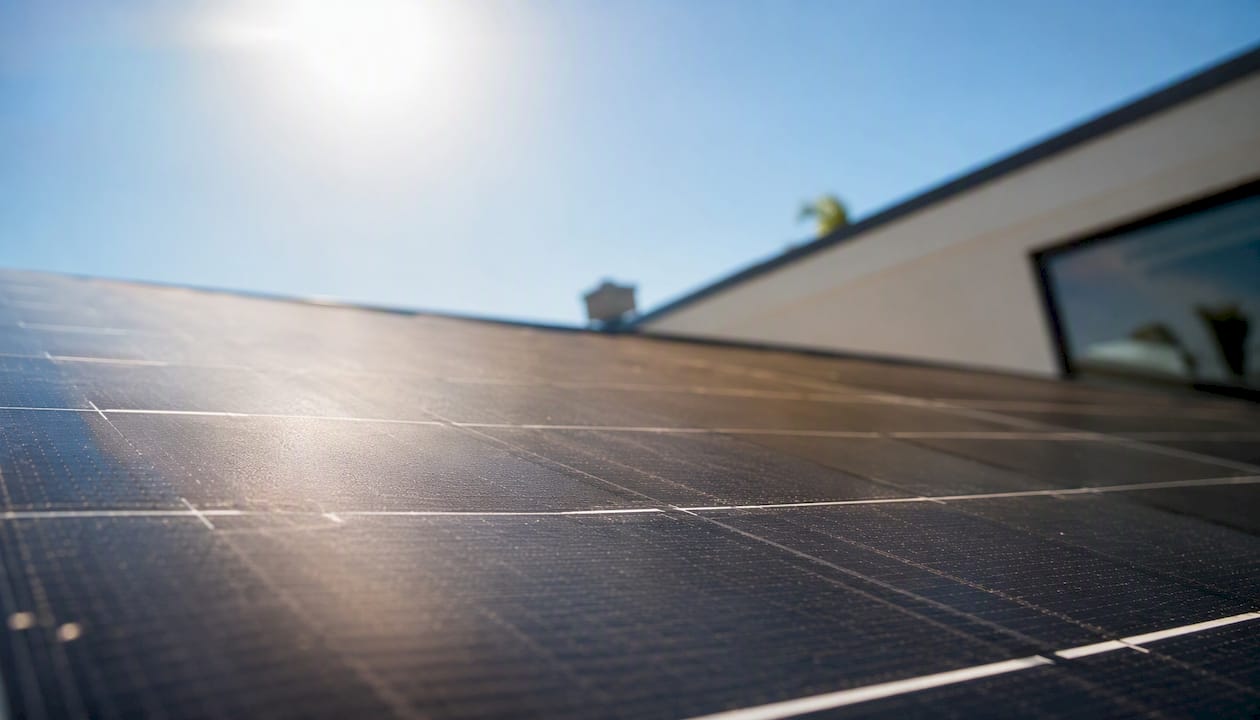
NOCT (Nominal Operating Cell Temperature) is a secondary rating that better approximates field conditions: 800 W/m² irradiance, 20°C ambient air, and a 1 m/s wind speed. It gives a more realistic picture of how hot a panel’s cells actually run during operation.
| Condition | Irradiance | Cell Temp | Wind | Purpose |
|---|---|---|---|---|
| STC | 1,000 W/m² | 25°C | None | Universal comparison benchmark |
| NOCT | 800 W/m² | ~45–48°C typical | 1 m/s | Field operating approximation |
The Wikipedia STC entry notes that nominal power divided by incident irradiance defines efficiency, which means any change in irradiance or temperature from STC shifts the actual output away from the nameplate number. A panel rated at 400W STC might deliver 340–370W under typical rooftop conditions. Plan for that gap when sizing a system.
What efficiency ranges look like today and which technologies produce them
According to the University of Michigan’s Solar PV Energy Factsheet, most commercially available residential modules achieve roughly 20–22% efficiency. Premium technologies push higher. Here is how the main technologies stack up:
- P-type monocrystalline PERC: The workhorse of residential solar for the past decade. Efficiency typically runs around 20%. Widely available, with well-understood degradation behavior and competitive pricing.
- N-type TOPCon (Tunnel Oxide Passivated Contact): The current mainstream premium option. Efficiency typically runs a little above 20%. Lower temperature coefficient than PERC and better low-light performance, which matters in overcast climates or on east/west-facing roofs.
- HJT (Heterojunction Technology): Combines crystalline silicon with thin amorphous silicon layers. Efficiency for commercial modules often exceeds that of standard products by a few percentage points. HJT panels tend to have the lowest temperature coefficients available, meaning they hold their rated output better in heat.
- Bifacial modules: Available in PERC, TOPCon, or HJT configurations. The front face carries the nameplate efficiency; the rear face captures reflected light (albedo) from the roof surface. Effective yield can exceed the nameplate STC rating under the right mounting conditions, but ground-mounted or elevated racking is needed to realize the rear-side gain. On a flush rooftop mount with a dark shingle, bifacial gain is minimal.
- Lab records vs. commercial products: NREL’s champion module data shows that lab-cell records for silicon technologies run well above what any retail module delivers. The gap between a lab record and a product you can actually buy is real and worth keeping in mind when a manufacturer’s marketing leans on cell-level numbers.
Factors that change how an efficiency rating translates to actual energy production
The nameplate efficiency is a starting point, not a guarantee. DOE/EERE guidance makes clear that temperature, spectrum, and field conditions all shift delivered output away from the lab number. Here are the factors that matter most:
- Temperature coefficient: Expressed as %/°C, this tells you how much power a panel loses for every degree above 25°C. A panel with a coefficient of -0.35%/°C operating at 55°C (30°C above STC) loses 10.5% of its rated output from heat alone. A panel with -0.26%/°C loses only 7.8% under the same conditions. In San Diego’s summer heat, that difference adds up across thousands of operating hours.
- Shading: Even partial shading on one cell can drag down an entire string of panels when using a conventional string inverter. A shadow from a vent pipe or tree branch at 9 AM can cut output by far more than the shaded area suggests.
- Soiling: Dust, bird droppings, and pollen accumulate on panel surfaces and block incoming light. Studies on soiling losses in California climates show output reductions that compound over months without cleaning.
- Tilt and azimuth: A south-facing roof at a moderate tilt captures more annual irradiance in most U.S. locations than an east or west-facing roof at the same tilt. East/west orientations reduce peak output but flatten the production curve across the day, which can actually improve self-consumption under NEM 3.0 rate structures.
- Inverter clipping: If the inverter’s AC capacity is smaller than the array’s DC peak, the inverter clips output on the sunniest hours. A small amount of clipping is often intentional and cost-effective; too much wastes production.
- Degradation rate: Panels lose efficiency slowly over time. Most manufacturers warrant no more than 0.5% annual degradation, with a floor around 80–87% of original output at year 25. A panel starting at 400W that degrades at 0.5%/year produces roughly 350W by year 25. That lifetime output curve matters more for ROI than the day-one nameplate number.
For a deeper look at how these variables combine into a real annual kWh number, understanding total system output is the logical next step.
Is higher efficiency always better? Cost, space, and ROI trade-offs
Not always. Higher efficiency panels cost more per watt, and on a large, unshaded south-facing roof, that premium does not always pay back faster than a standard module would.
Two scenarios illustrate the decision:
Scenario A: Ample roof space, budget-sensitive homeowner. You have 800 square feet of south-facing roof and want a 10 kW system. Mid-range 20% efficiency panels fit comfortably, and the lower cost per watt means a shorter payback period. The extra efficiency buys you nothing you can use.
Scenario B: Limited or complex roof, or a multi-story home. Your usable south-facing roof area caps you at 6 kW with standard panels. Stepping up to 22–23% efficiency modules might let you fit 7–7.5 kW in the same space, which meaningfully changes your annual production and bill offset. Here the premium is justified.
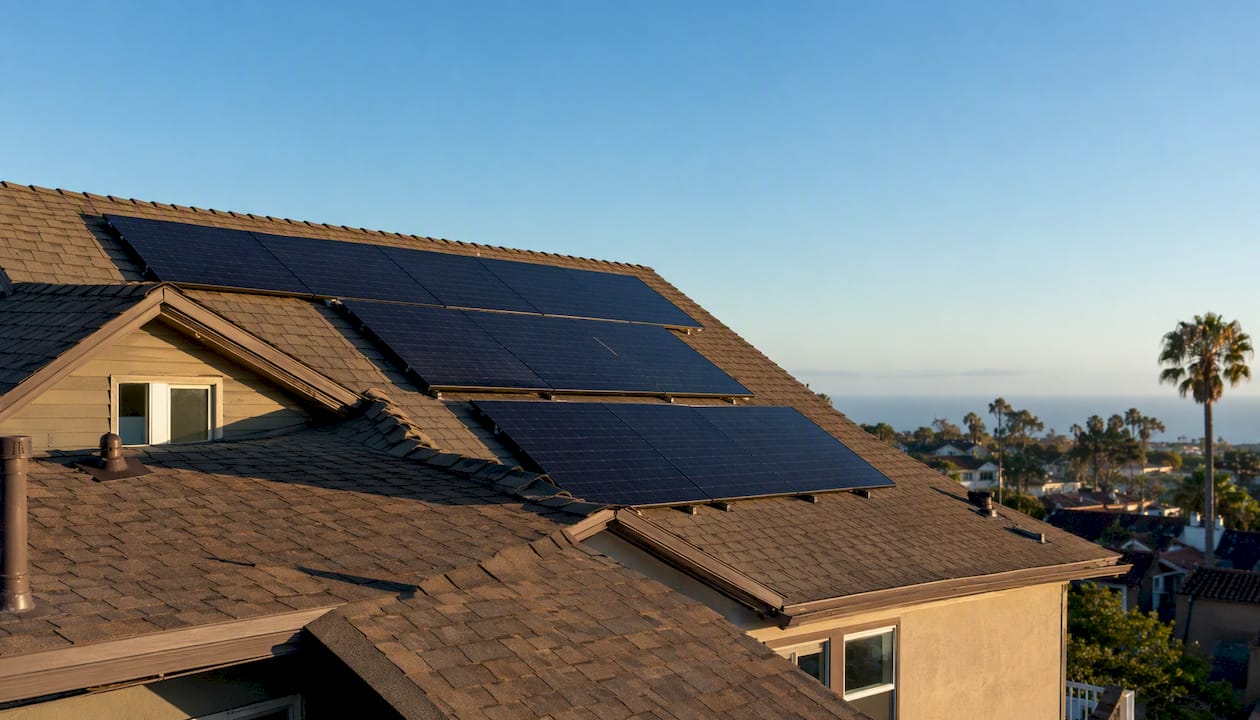
A practical rule of thumb: if your roof geometry or shading limits you to fewer panels than your energy goals require, higher efficiency is worth the cost. If you have room to add panels instead, the math usually favors more standard modules over fewer premium ones. The residential solar design process should always start with a roof assessment before a panel selection.
One non-obvious advantage of higher-efficiency panels: they preserve roof capacity. A denser array leaves physical space for future additions, battery ventilation, or a roof replacement without a full redesign.
What professional installers look at beyond the efficiency number
Efficiency is the number homeowners ask about. It is rarely the number installers argue about.
- Degradation warranty terms — The year-25 floor percentage and annual degradation rate determine lifetime energy production. A panel with 87% at year 25 produces meaningfully more total energy than one warranted to 80%, even if both start at the same wattage.
- PVWatts modeling. NREL’s PVWatts calculator converts your system’s STC wattage, tilt, azimuth, and ZIP code into an expected annual kWh output. Installers use this to translate nameplate efficiency into a real production number for your specific roof and location.
Questions to ask your installer before signing: What annual kWh does your PVWatts model show for my address and roof orientation? What degradation rate did you assume? What is the year-25 production estimate? Does the warranty cover both product defects and power output? Who handles warranty claims if the manufacturer exits the market?
For a full checklist of what to ask before signing, the 2026 homeowner installer guide covers the key questions in detail.
How to improve your system’s effective efficiency
The panel’s rated efficiency is fixed at the factory. Your system’s realized efficiency is not.
- Optimize tilt and azimuth at the design stage. South-facing at 20–30° tilt maximizes annual yield for most U.S. locations. East/west splits reduce peak output but spread production more evenly across the day, which can improve self-consumption under time-of-use rates.
- Right-size the inverter. A DC-to-AC ratio of roughly 1.1–1.25 is standard for most residential systems. Too low and you clip production on sunny days; too high and the inverter runs at low efficiency during off-peak hours.
- Choose microinverters or DC optimizers for shaded or complex roofs. String inverters pull the whole string down to the weakest panel. MPPT-based power electronics at the panel level let each module operate at its own peak, recovering production that a string inverter would lose. The net benefit is real on roofs with any shading, multiple orientations, or mixed panel exposure.
- Schedule annual soft-wash cleaning. Soiling losses accumulate quietly. A professional panel cleaning service removes dust, pollen, and bird droppings that reduce the light reaching the cells. In San Diego’s dry summers, this matters more than in wetter climates where rain does some of the work.
- Manage thermal issues. Panels mounted flush to a dark roof with no air gap run hotter than panels on elevated racking. If you are re-roofing before installation, a lighter-colored roof surface and a small standoff gap both reduce operating temperature and improve output.
- Pair with battery storage to maximize self-consumption. A panel’s effective value depends on when you use the electricity it generates. Under NEM 3.0, excess midday production exported to the grid earns less than power consumed directly or stored. Pairing your system with a Tesla Powerwall, Enphase IQ battery, or Franklin WH unit captures that midday surplus and shifts it to evening peak hours. The ROI case for battery backup is strongest when your utility has high time-of-use rates, which describes SDG&E precisely.
Pro Tip: If your roof has even one area of partial shading for more than an hour a day, microinverters or DC optimizers will recover more annual production than upgrading from a 20% to a 22% efficiency panel. Fix the shading problem before chasing the efficiency number.
Key Takeaways
A solar panel’s efficiency rating tells you how much roof space you need per kilowatt, but temperature coefficient, degradation warranty, and a modeled yield estimate matter just as much for long-term ROI.
| Point | Details |
|---|---|
| Efficiency % measures roof-space density | Higher efficiency means more watts per square foot; critical when roof area is limited. |
| STC ratings overstate field output | Real rooftop output runs 10–15% below nameplate due to heat, soiling, and wiring losses. |
| Temperature coefficient affects hot-climate output | A coefficient of -0.26%/°C vs. -0.38%/°C can mean a meaningful production difference in summer. |
| Degradation warranty determines lifetime yield | A year-25 floor of 87% vs. 80% produces significantly more total energy over the system’s life. |
| San Diego Solar models yield before you commit | In-house engineering uses PVWatts and site data to translate panel specs into real annual kWh for your roof. |
The efficiency number is only the starting point
The solar industry has done homeowners a disservice by centering the efficiency conversation on a single percentage. That number is useful, but it answers only one question: how much roof space does this panel need per watt? It says nothing about how the panel performs at 55°C, what it produces in year 20, or whether the manufacturer will still be around to honor the warranty.
The installers who have been doing this work for decades tend to look at temperature coefficient and degradation terms before they look at nameplate efficiency. A 22% panel with a poor temperature coefficient and an 80% year-25 warranty can easily underperform a 20% panel with a -0.26%/°C coefficient and an 87% year-25 floor over a 25-year system life. The math is not even close.
There is also a design argument for choosing higher efficiency that rarely gets mentioned: it preserves roof capacity. A denser array leaves room for future additions, better airflow, or a roof replacement without a complete system redesign. For homeowners who plan to add an EV charger or a second battery bank in five years, that flexibility has real value.
The bottom line is that efficiency is a useful shorthand, not a verdict. Use it to compare roof-space requirements. Then go deeper on the spec sheet before you sign anything.
San Diego Solar’s approach to panel selection and yield modeling
Thirty years of residential installations across San Diego County have taught one consistent lesson: the homeowners who get the best long-term results are the ones who saw a modeled yield estimate before they chose a panel, not after.

San Diego Solar’s in-house engineering team runs a full PVWatts-based yield model for every system, factoring in your roof’s exact tilt, azimuth, shading profile, and local irradiance data before recommending a panel. No subcontractors, no guesswork on sizing, and no pressure to buy a premium module when a mid-range panel fits your roof and goals just as well. The 30% federal tax credit applies to panels, battery storage, and installation, and most San Diego homeowners see full payback in 5–7 years with electric bill reductions of 80–92%.
Schedule a free consultation to get a modeled yield estimate for your specific roof, backed by 30 years of in-house installation experience and manufacturer warranties up to 25 years.
Authoritative sources and tools for modeling your system
- Standard_test_conditions
- Solar photovoltaic performance and efficiency basics
- Solar PV Energy Factsheet | Center for Sustainable Systems
- PVWatts® Calculator
- Champion module chart (NREL)
- Solar performance and efficiency
- Standard test conditions - Wikipedia
- Photovoltaics and electricity (EIA)