What Is Solar System Output? A Homeowner's Guide
What Is Solar System Output? A Homeowner’s Guide

Solar system output is defined as the total electrical energy your solar panels produce, measured in watts (power at a moment in time) and kilowatt-hours (energy produced over time). This number determines how much of your home’s electricity demand the sun can cover. Understanding what is solar system output helps you size a system correctly, set realistic savings expectations, and catch performance problems before they cost you money. The industry standard term for this concept is system energy yield, and it depends on far more than the wattage printed on your panels.
What is solar system output, and how is it measured?
Solar panel output has two numbers that homeowners often confuse: rated wattage and actual energy production. Rated wattage is measured under Standard Test Conditions (STC), which means 25°C panel temperature, 1,000 watts per square meter of irradiance, and no wind. Real rooftops never match those lab conditions.
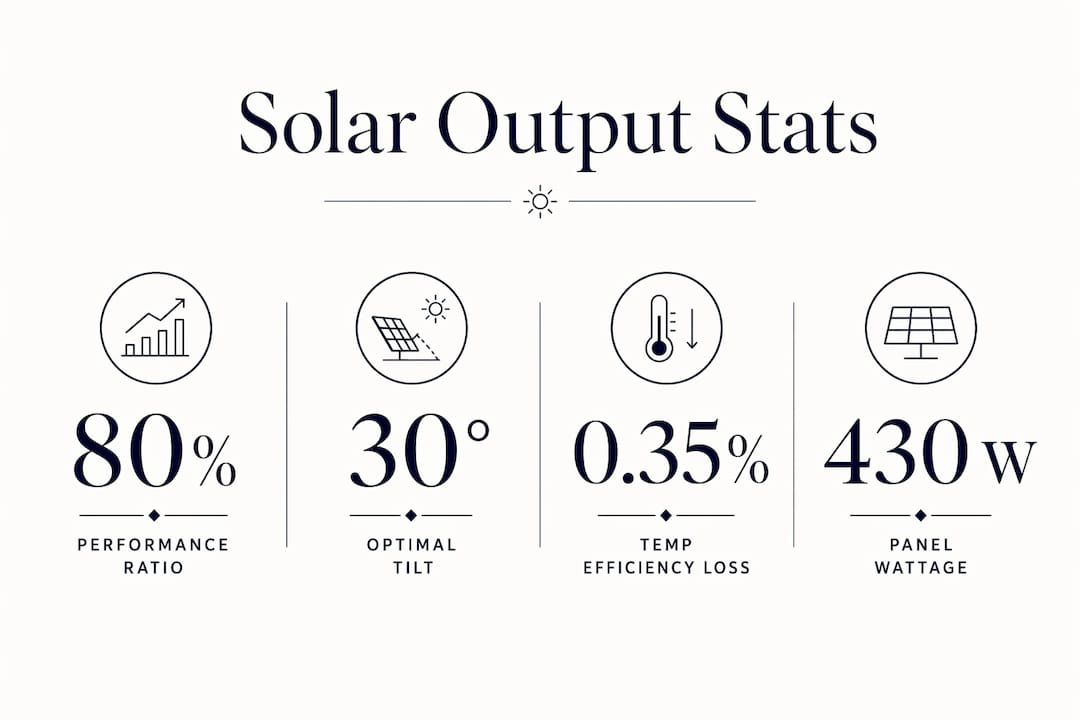
Real-world output runs at 75–85% of rated power, a ratio the industry calls the Performance Ratio (PR). A system rated at 10 kilowatts (kW) typically delivers 7.5–8.5 kW of effective capacity in practice. That gap comes from wiring resistance, inverter losses, soiling, and temperature effects.

The table below shows how rated output and real output diverge under different conditions.
| Condition | Rated output (10 kW system) | Estimated real output |
|---|---|---|
| Ideal STC (lab) | 10,000 W | 10,000 W |
| Mild day, clean panels | 10,000 W | 8,500 W |
| Hot summer day (35°C+) | 10,000 W | 7,200 W |
| Partial shading (20%) | 10,000 W | 6,000 W |
| Dusty, unclean panels | 10,000 W | 7,000 W |
The kilowatt-hour (kWh) is the unit on your electric bill. A 10 kW system producing at 80% efficiency for 5 peak sun hours generates roughly 40 kWh per day. That daily figure is what actually offsets your SDG&E charges.
Pro Tip: Panel wattage alone does not tell you how much electricity your home will use from the sun. Always ask your installer for a projected annual kWh figure, not just a panel count or system size in kW.
What factors affect solar energy production the most?
Location is the single largest variable in solar energy production. Peak sun hours vary dramatically by region: Phoenix receives around 6.5 peak sun hours per day, while Seattle averages 3.8. That difference means a 10 kW system in Arizona produces roughly 40% more electricity per year than the same system in the Pacific Northwest.
Roof orientation and tilt come second. A south-facing roof at a 30-degree tilt captures the most annual irradiance in the continental United States. East or west-facing roofs lose 10–20% of potential output compared to a true south orientation. Flat roofs can use tilt mounts to correct the angle.
Temperature is the factor most homeowners overlook. Solar panels lose about 0.3–0.4% efficiency for every degree Celsius above 25°C. On a hot San Diego afternoon, panel surface temperatures can reach 55–65°C, cutting peak output by 10–15%. A light-colored or cool roof underneath the panels reduces that heat buildup.
Soiling from pollen, dust, and debris can reduce output by 2–25% depending on your climate and how long panels go without cleaning. That is not a small number. A system losing 15% to dirt is effectively a system one or two panels short of its design capacity.
The five factors homeowners can directly control or monitor are:
- Panel cleanliness. Wash panels at least once or twice per year, more often in dusty inland areas.
- Shade management. Trim trees that have grown to cast new shadows on your array.
- Monitoring alerts. Use your inverter’s monitoring app to catch production drops early.
- Inverter health. Inverters typically last 10–15 years; a failing inverter tanks whole-system output.
- Roof orientation decisions. When re-roofing, consider whether a different panel layout improves annual yield.
Pro Tip: If you are in San Diego’s inland communities like Poway or Escondido, panel cleaning matters more than on the coast. Dry, dusty summers accumulate soiling faster, and professional panel cleaning pays for itself in recovered production.
How do you calculate solar panel output for your home?
The solar panel output calculation starts with your annual electricity consumption in kWh, which you can find on 12 months of utility bills. Divide that number by your location’s specific yield to get the system size you need.
Specific yield is the annual energy a system produces per kilowatt of installed capacity, expressed in kWh/kW-year. U.S. specific yields range from 1,100 kWh/kW-year in cloudy northern states to 1,700 kWh/kW-year in the Southwest. San Diego typically falls in the 1,500–1,600 kWh/kW-year range.
Here is the formula:
System size (kW) = Annual usage (kWh) ÷ Specific yield (kWh/kW-year)
A household using 10,000 kWh per year in San Diego needs roughly a 6.5 kW system. That same household in Seattle would need closer to 9 kW to produce the same annual energy.
NREL’s PVWatts Calculator is the industry-standard tool for this estimate. Enter your address, roof tilt, and orientation, and it applies a system loss factor to model real-world production. Most installers use PVWatts or a similar tool to generate the annual kWh projections in your proposal.
The table below shows how system size and panel count shift by region for a home using 10,000 kWh per year, assuming 430-watt panels.
| Region | Specific yield (kWh/kW-year) | System size needed | Panel count (430 W) |
|---|---|---|---|
| San Diego, CA | 1,550 | 6.5 kW | 15 panels |
| Phoenix, AZ | 1,700 | 5.9 kW | 14 panels |
| Dallas, TX | 1,400 | 7.1 kW | 17 panels |
| Seattle, WA | 1,100 | 9.1 kW | 21 panels |
One more technical point worth knowing: the DC-to-AC inverter ratio. A DC/AC ratio of 1.15–1.30 is the industry best practice, meaning the panel array is slightly oversized relative to the inverter. This improves energy capture during morning and afternoon hours when the sun is at an angle, even if it causes brief “clipping” at peak noon output. NREL targets roughly a 1.2 DC/AC ratio for residential systems.
What homeowners get wrong about maximizing solar system efficiency
The most common mistake is chasing panel efficiency ratings instead of system yield. Panel efficiency (typically 17–23%) mainly affects how much roof space you need per watt. It does not increase the energy a system produces per kW installed. A 20% efficient panel on a shaded roof still underperforms a 17% efficient panel on a clear south-facing roof.
Location and roof orientation have a larger impact on annual output than panel efficiency. Homeowners who spend extra money on premium efficiency panels while ignoring shading or orientation often see disappointing results.
The second mistake is ignoring monitoring data. Every modern inverter system includes a monitoring app. A sudden 10–15% drop in daily production is a signal worth investigating. It could be a dirty panel, a failing microinverter, or a new shadow from a neighbor’s tree. Catching it early prevents months of lost production.
Common pitfalls and how to avoid them:
- Accepting vague installer projections. Ask for a PVWatts report or equivalent showing annual kWh, not just system size.
- Skipping maintenance. Soiling losses of 2–25% are avoidable with basic cleaning.
- Ignoring temperature effects. Panel ventilation and roof color affect output more than most homeowners realize.
- Oversizing without battery storage. Under NEM 3.0 in California, excess daytime production earns less without a battery to store it.
- Assuming all installers model output the same way. Ask specifically what system loss factor and specific yield assumptions appear in your proposal.
Pro Tip: Ask any installer you are evaluating to show you their PVWatts assumptions. A reputable company will share the exact inputs used to generate your annual kWh estimate. If they cannot, that is a red flag.
Key Takeaways
Solar system output depends on location, roof conditions, and real-world losses far more than panel wattage ratings alone, making specific yield the most reliable metric for homeowners sizing a system.
| Point | Details |
|---|---|
| Rated vs. real output | Real-world systems deliver 75–85% of rated power due to heat, soiling, and inverter losses. |
| Specific yield is the key metric | Divide annual kWh usage by local specific yield (1,100–1,700 kWh/kW-year) to size your system correctly. |
| Location beats panel efficiency | Roof orientation and peak sun hours affect output more than panel efficiency ratings. |
| Temperature cuts peak production | Panels lose 0.3–0.4% output per degree Celsius above 25°C; cool roofs and airflow help. |
| Maintenance protects your yield | Soiling alone can reduce output by 2–25%; regular cleaning and monitoring preserve performance. |
Why homeowners should stop fixating on panel specs
I have had hundreds of conversations with homeowners who walk into a consultation holding a printout of panel efficiency specs. They want the highest number on the sheet. I understand the instinct. It feels like buying a faster car engine. But solar does not work that way.
The spec that actually predicts your electric bill savings is specific yield, not panel efficiency. I have seen 400-watt panels on a well-oriented, clean San Diego roof outperform 460-watt panels on a partially shaded east-facing roof every single year. The roof wins. The location wins. The design wins.
What I tell homeowners is this: focus on three things. First, get a PVWatts-based annual kWh projection from your installer, not just a system size. Second, understand your peak sun hours and how your roof orientation affects them. Third, commit to basic maintenance. A clean, monitored system on a good roof will outperform a neglected premium system within two or three years.
The other thing I have learned is that monitoring is underused. Most homeowners set up their inverter app once and never look at it again. That app is your early warning system. A 10% production drop that you catch in week one costs you almost nothing. The same drop ignored for six months costs you real money in lost generation and potentially a bigger repair bill.
San Diego is genuinely one of the best solar markets in the country. The specific yield here is exceptional. But that advantage only pays off when the system is sized right, installed correctly, and maintained over time.
— Curtis Williamson
San Diego Solar’s approach to sizing and output
Understanding your solar output potential is the first step. Acting on it with a well-designed system is the second.

San Diego Solar has designed and installed residential solar systems across San Diego County since 1996, using 100% in-house crews with no subcontractors. Every system starts with a custom output analysis based on your actual utility bills, your roof’s orientation, and your local specific yield. The goal is a projected annual kWh figure you can hold the system accountable to, not a panel count that sounds impressive. San Diego Solar also handles all permitting, SDG&E interconnection, and HOA approvals. Get a free solar quote and see exactly what your roof can produce.
FAQ
What is solar system output measured in?
Solar system output is measured in watts (W) for instantaneous power and kilowatt-hours (kWh) for energy produced over time. Your electric bill is denominated in kWh, making that the more useful number for homeowners.
How much output does a typical residential solar system produce?
A typical U.S. residential system produces between 8,000 and 14,000 kWh per year depending on system size and location. Specific yields range from 1,100 to 1,700 kWh per kW installed annually.
Why is my solar system producing less than its rated output?
Real-world output is always lower than rated output because of heat, wiring losses, inverter efficiency, and soiling. The industry Performance Ratio of 0.75–0.85 means a 10 kW system realistically delivers 7.5–8.5 kW of effective capacity.
Does panel efficiency affect how much energy my system produces?
Panel efficiency affects how much roof space you need, not how much energy a system produces per kW installed. Location and roof orientation have a greater impact on annual energy yield than efficiency ratings.
How can I increase my solar system’s output?
Keep panels clean, monitor production data regularly, and address shading from trees or new structures. Soiling and debris can reduce output by 2–25%, making basic maintenance one of the highest-return actions a homeowner can take.