Why Solar Beats Energy Inflation: A Homeowner's Guide
Why Solar Beats Energy Inflation: A Homeowner’s Guide

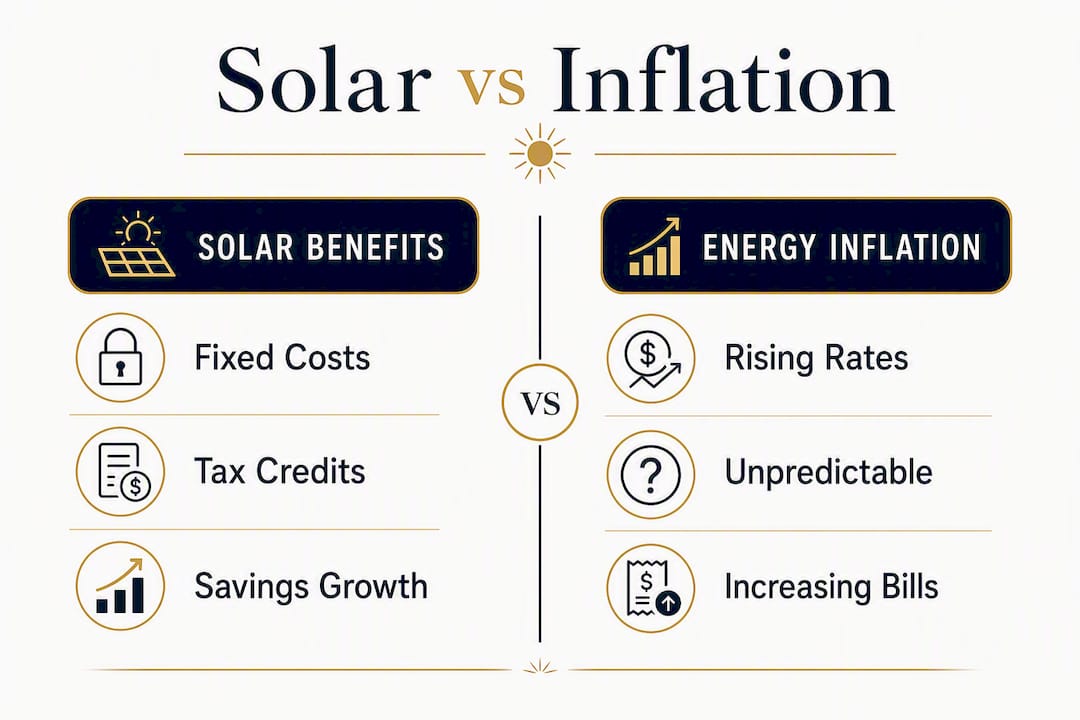
Solar beats energy inflation because it converts a variable, utility-controlled cost into a largely fixed, self-owned energy cost. Once your system is installed, your per-kilowatt-hour cost is essentially locked. The grid’s cost keeps climbing.
The short version:
- Nationwide residential electricity prices rose 27% between 2021 and 2025, outpacing general consumer inflation by a wide margin.
- Homeowners who own or finance solar fix most of their energy cost at installation. The utility’s future rate hikes become largely irrelevant to that portion of their bill.
- Most San Diego homeowners who install through San Diego Solar see full payback in 5–7 years and electric bill reductions of 80–92%.
- The hedge weakens under heavy shading, very low retail rates, short time horizons, or unfavorable net-metering policy. Screen for those first.
Table of Contents
- How inflation and macro forces push your electricity bill higher
- Why solar is such an effective hedge against rising energy costs
- How much solar actually saves: payback, ROI, and a worked example
- How incentives, tax credits, and net metering strengthen the hedge
- When solar might not beat inflation: limits and realistic expectations
- What recent U.S. data and San Diego Solar’s installation experience show
- Key Takeaways
- The case for solar as a protective investment
- San Diego Solar can show you exactly what your hedge looks like
- Sources and tools for further reading
How inflation and macro forces push your electricity bill higher
The story is not simply that energy costs rise with inflation. Retail electricity prices have been outpacing the Consumer Price Index for structural reasons that show no sign of reversing.
Residential electricity prices rose 27% between 2021 and 2025. Over that same period, the CPI rose considerably less. The gap reflects a set of compounding pressures:
- Grid hardening and modernization. Utilities are spending billions to harden transmission lines against wildfires, storms, and extreme heat. Those capital costs flow directly into your rate.
- Aging infrastructure replacement. Much of the U.S. grid was built in the 1950s–1970s. Replacing it is expensive, and ratepayers fund it.
- Surging demand from data centers and AI. Grid hardening, transmission replacement, and rapidly rising demand from data centers and AI workloads are compounding the rate pressure that households already face.
- Fuel-price shocks. Natural gas still sets the marginal price of electricity across much of the country. Geopolitical disruptions hit hard: one analysis found the average U.S. household paid roughly $447 more on energy due to the energy-market impact of the Iran conflict documented in May 2026.
- Utility revenue models. Regulators allow utilities to earn a guaranteed return on capital investment. More capital spending means higher allowed revenues, which means higher rates.
Statistic: Residential electricity prices rose 27% from 2021 to 2025, while 1 in 3 U.S. households now reports difficulty paying energy bills. The structural drivers behind those increases are still accelerating.
None of these pressures are temporary. Grid hardening is a decade-long program. Data center demand is growing. The implication: utility rate increases are not a one-time event but an ongoing, open-ended risk.
Why solar is such an effective hedge against rising energy costs
The core mechanism is asymmetry. Your utility’s price has unlimited upside. Your solar system’s cost is fixed the day it is installed.
-
Fixed levelized cost of energy. When you own or finance a solar system, your effective per-kWh cost is determined by the system price divided by lifetime production. That number does not change when SDG&E files for a rate increase. A financed system locks in a monthly payment; an owned system locks in a cost of near zero per kWh after payback.
-
Net metering and export credits. Under net metering, excess solar production offsets future utility consumption. Under California’s NEM 3.0, pairing solar with battery storage maximizes the value of that offset by shifting self-consumption to peak-rate hours, when grid power is most expensive.
-
Self-consumption plus battery storage. A solar battery stores midday production for evening use, reducing the hours you draw from the grid at peak rates. The more of your consumption you cover with stored solar, the less exposure you carry to utility price swings.
-
Avoided demand charges. For small businesses, demand charges can represent 30–50% of a commercial electricity bill. Solar production during peak demand hours directly cuts that charge, and batteries can shave demand peaks further.
-
Property value appreciation. Studies consistently show that solar installations increase home resale value, meaning the hedge has a secondary financial benefit beyond bill reduction.
-
Compounding savings over time. Because your solar cost is fixed while utility rates keep rising, the annual dollar savings from your system tend to grow each year. The gap between what you would have paid the utility and what you actually pay widens as rates climb.
The asymmetry is the key insight. You are not just saving money today. You are buying out of a cost structure that has a demonstrated upward trend and no ceiling.
Pro Tip: When evaluating a solar proposal, ask for a sensitivity analysis showing your projected savings at 2%, 4%, and 6% annual utility rate escalation. The difference between those scenarios tells you exactly how much the hedge is worth to you.
How much solar actually saves: payback, ROI, and a worked example
EnergySage data shows solar shoppers can save tens of thousands of dollars on electricity over 25 years, varying based on location, system size, and incentives. San Diego sits at the high end of that range because SDG&E rates are among the highest in the country.
Here is a representative worked example for a San Diego homeowner:
- System size: 8 kW
- Estimated annual production: 12,000 kWh
- Current SDG&E blended rate: $0.42/kWh (approximate)
- Year-1 bill savings: ~$5,040
- System cost after 30% federal tax credit: ~$21,000
- Simple payback: approximately 4.2 years
- 25-year savings (at 4% annual rate escalation): $41,000–$155,000, with most San Diego homeowners at the high end of this range
That payback shortens further if you use San Diego Solar’s prepaid lease program, which reduces upfront costs by 30–40%. For a deeper breakdown of local system costs, the San Diego solar cost guide walks through financing scenarios in detail.
How utility escalation rate changes your 25-year outcome
| Utility rate escalation | Year-1 savings | Year-10 savings | 25-year total savings |
|---|---|---|---|
| 2% per year | ~$5,040 | — | — |
| 4% per year | ~$5,040 | — | — |
| 6% per year | ~$5,040 | — | — |

Figures are illustrative estimates based on the worked example above. Actual results depend on system production, rate structure, and financing terms.
The table makes the compounding effect concrete. At 2% escalation, the hedge is good. At 6%, it is exceptional. Given that residential electricity rose 27% in just four years, a 4–6% annual escalation assumption is not aggressive.
Financing structure matters too. A cash purchase delivers the fastest payback and the largest lifetime return. A low-rate solar loan fixes your monthly cost below your current utility bill from day one. San Diego Solar’s prepaid lease reduces upfront exposure while still locking in a predictable energy cost. High-interest financing narrows the margin, so the rate you secure matters as much as the system price.
Pro Tip: Production estimates are only as good as the shade analysis behind them. Ask your installer for a shading report from a tool like Aurora Solar or Solargraf, and confirm the azimuth and tilt assumptions. An optimistic production estimate is the single most common source of disappointing ROI.
How incentives, tax credits, and net metering strengthen the hedge
Incentives do not just reduce upfront cost. They shorten payback, which means you reach the “free energy” phase of ownership sooner, and they increase the total lifetime return on the investment.
- Federal Investment Tax Credit (ITC). The ITC currently covers 30% of the total installed cost of solar panels, battery storage, and installation labor. That credit applies dollar-for-dollar against your federal tax liability. On a $30,000 system, that is $9,000 back.
- California state incentives. California’s Self-Generation Incentive Program (SGIP) provides rebates for battery storage, with enhanced incentives for customers in high-fire-risk zones. Amounts vary by utility and program cycle.
- Net Energy Metering (NEM 3.0). California’s current NEM 3.0 framework credits exported solar energy at a time-of-use rate rather than the full retail rate. This makes battery storage more valuable, because storing and self-consuming solar during peak hours is worth more than exporting it. San Diego Solar specializes in NEM 3.0 solar-plus-battery strategies designed specifically to maximize self-consumption under this structure.
- Accelerated depreciation for businesses. Commercial and small-business owners can use MACRS depreciation (typically 5-year) to recover system costs faster, materially improving the after-tax ROI.
- Property tax exclusion. California excludes the added home value from a solar installation from property tax assessment, so your property tax bill does not rise when your home value does.
Pro Tip: The federal ITC applies to battery storage even when the battery is installed without solar, as long as it is charged primarily from renewable sources. If you are not ready for a full system, a storage-first approach can still qualify.
One important caveat: net-metering rules and state incentive programs change. California’s NEM 3.0 was itself a significant shift from NEM 2.0. Always verify current tariff structures with your utility and confirm incentive availability before signing a contract. The Department of Energy’s solar savings resource is a reliable starting point for understanding federal-level economics.
When solar might not beat inflation: limits and realistic expectations
Solar is not the right answer for every property or every financial situation. Here is where the inflation-hedge case weakens:
- Very low retail electricity rates. If you pay $0.10–$0.12/kWh, your savings per kWh are small and payback stretches to 15+ years. The hedge still exists, but the financial case is thin.
- Heavy shading or poor solar access. A roof with significant tree, chimney, or neighboring-structure shading can reduce production enough to raise your effective cost per kWh above the utility rate. This is the most underestimated risk.
- Short time horizon. Solar’s financial case is built on 15–25 years of production. If you plan to sell within 3–5 years, you may not reach payback, though resale value partially offsets this.
- High financing costs. A solar loan at 10–12% interest can push your monthly payment above your current utility bill, eliminating the near-term hedge. Low-rate financing is not always available to every borrower.
- Unfavorable net-metering or interconnection policy. In some states and utility territories, export credits are minimal or interconnection queues are long. California is relatively favorable, but this varies significantly elsewhere.
- Roof condition or structural issues. A roof that needs replacement within 5 years should be addressed before or alongside solar installation. San Diego Solar’s solar plus roofing packages address this directly by combining both projects under one warranty and one crew.
Pro Tip: Solar rarely eliminates your utility bill entirely. Most utilities charge a fixed monthly grid-connection fee regardless of how much solar you produce. Budget for a small residual bill, typically $10–$30/month, even with a well-sized system and battery.
A solar-plus-battery strategy can push self-consumption high enough to minimize grid exposure, but the goal is to reduce variable utility spending, not to disconnect entirely. That distinction matters when you are modeling the hedge.

What recent U.S. data and San Diego Solar’s installation experience show
The data picture is consistent. Pew Research confirms that residential electricity prices rose 27% from 2021 to 2025, and solar.com’s analysis shows that electricity has been outpacing overall inflation by close to 2x. The Solar Energy Industries Association identifies clean energy incentives as one of the most direct tools for stabilizing household energy costs. Academic research published in Energies in 2025 explicitly frames solar PV investment as an inflation hedge, noting that it produces non-taxed financial returns and fixes energy costs over decades.
San Diego Solar’s installation data from across San Diego County reflects these national trends, with local amplification because SDG&E rates are consistently among the highest in the U.S.:
- Homeowners who installed 7–10 kW systems with battery storage in 2021–2023 have seen their avoided utility costs grow each year as SDG&E rates have increased, with most reporting 80–92% reductions in their monthly electric bills.
- Systems installed before SDG&E’s most recent rate increases have seen their effective payback period shorten retroactively, because the savings each year are larger than the original model projected.
How solar savings compare to grid costs over time
| Scenario | Year 1 | Year 5 | Year 10 | Year 25 |
|---|---|---|---|---|
| Grid-only (4% annual escalation) | Baseline | — | — | — |
| Owned solar (fixed cost after payback) | Savings begin | Savings grow | Savings accelerate | Near-zero marginal cost |
| Financed solar (fixed payment) | Bill neutral or positive | Payment fixed; grid rate higher | Large positive spread | Payment ends; savings maximize |
The compounding effect is what makes solar a genuine inflation hedge rather than just a cost-reduction tool. A fixed cost against a rising benchmark produces expanding savings every year.
Key Takeaways
Solar beats energy inflation because it fixes your energy cost at installation while utility rates continue to rise, creating savings that compound over decades.
| Point | Details |
|---|---|
| Electricity outpaces CPI | Residential electricity prices have significantly outpaced general consumer inflation in recent years. |
| Fixed cost is the hedge | Owned or financed solar locks your per-kWh cost; utility rate increases no longer affect that portion of your bill. |
| 25-year savings are substantial | EnergySage data shows typical savings of $41,000–$155,000 over 25 years; San Diego homeowners often land at the high end. |
| Incentives accelerate payback | The 30% federal ITC, SGIP battery rebates, and NEM credits materially shorten payback and increase lifetime ROI. |
| San Diego Solar | San Diego Solar designs NEM 3.0 solar-plus-battery systems for San Diego County homeowners, with 5–7 year payback and 80–92% bill reductions. |
The case for solar as a protective investment
The conventional framing of solar as an environmental choice undersells it. The stronger argument, backed by the data, is financial: solar is one of the few investments that directly offsets a cost you cannot avoid, produces a non-taxed return, and compounds in value as the underlying cost it replaces keeps rising.
What most homeowners underestimate is the asymmetry. Every year you delay, utility rates move against you. The system you install today locks in today’s economics, including today’s incentive levels, which have already shifted once with NEM 3.0 and could shift again. The homeowners who regret going solar are rare. The ones who regret waiting are common.
The hedge is not perfect. Shading, financing costs, and policy changes are real variables. But for a San Diego homeowner with a south- or west-facing roof, moderate-to-high SDG&E usage, and a 10-plus year horizon, the case is about as close to a straightforward financial decision as residential energy gets. The question is not really whether solar beats inflation. It is whether your specific property and financial situation let it do so at full strength.
San Diego Solar can show you exactly what your hedge looks like
Knowing the national numbers is useful. Knowing your numbers is what actually matters.

San Diego Solar has been designing and installing residential solar systems in San Diego County since 1996, with 100% in-house crews and zero subcontractors. Every consultation starts with a real bill analysis, a shade assessment, and a production model built around your specific roof, not a national average. The 30% federal tax credit applies to panels, battery storage, and installation labor. Most San Diego homeowners reach full payback in 5–7 years and reduce their electric bills by 80–92%.
For homeowners with a roof that needs attention, San Diego Solar’s solar plus roofing packages combine both projects under one warranty and one crew, eliminating the coordination risk and often reducing total project cost. For homeowners focused on maximizing self-consumption under NEM 3.0, battery storage options including Tesla Powerwall, Enphase IQ, and Franklin WH are part of every system design conversation.
Get a free consultation and find out what your system would save, what it would cost, and how quickly it pays back under your actual SDG&E rate.
Sources and tools for further reading
The figures in this article draw from the following sources. Use them to verify claims or run your own estimates.
| Source | What it covers |
|---|---|
| DOE: Will I Save Money with Solar? | Federal overview of solar savings factors and household variability |
| Pew Research: Rising Home Energy Bills | Survey data on residential electricity price increases 2021–2025 |
| Solar.com: Electricity Outpacing Inflation | Analysis of electricity vs. CPI trends and structural drivers |
| EnergySage: Solar Panel Savings | Marketplace data on 25-year savings ranges by location |
| SEIA: Solar Fights Inflation | Industry analysis of clean energy incentives as inflation tools |
| Energies (2025): Solar PV as Inflation Hedge | Peer-reviewed academic analysis of solar as an inflation-hedging investment |
| CNBC: Energy Costs and Geopolitical Shocks | Household energy cost impact of fuel-price shocks |
| The Conversation: Households Struggling with Energy Bills | Federal survey data on energy affordability |
Key tools for your own estimates:
- NREL PVWatts Calculator (pvwatts.nrel.gov): Enter your address, system size, and tilt to get a production estimate. The most important inputs are azimuth, tilt, and the shading derate factor.
- SDG&E rate schedules (sdge.com): Look up your current time-of-use rate tier to calculate your actual blended rate, which is the number that drives your savings model.
- EnergySage Marketplace (energysage.com): Compare multiple installer quotes and see production estimates side by side.
- San Diego Solar free consultation: Combines a bill analysis, shade assessment, and NEM 3.0 production model specific to your property. No obligation, written timeline provided before you commit.
This article provides general financial and energy information. It is not professional financial or tax advice. Verify current incentive levels, utility tariffs, and tax credit eligibility with a qualified professional or the relevant federal and state agencies before making investment decisions.